Unlocking Organisational Agility: Key product metrics every business leader should measure
by Sam Adesoga·On July 23rd, 2023•Updated on May 14th, 2025
Share to
In today’s rapidly evolving business landscape, characterised by entrants of newer players into established business domains, changing users’ needs, and new technology being introduced faster than most organisations can keep up with, organisational agility is critical for success.
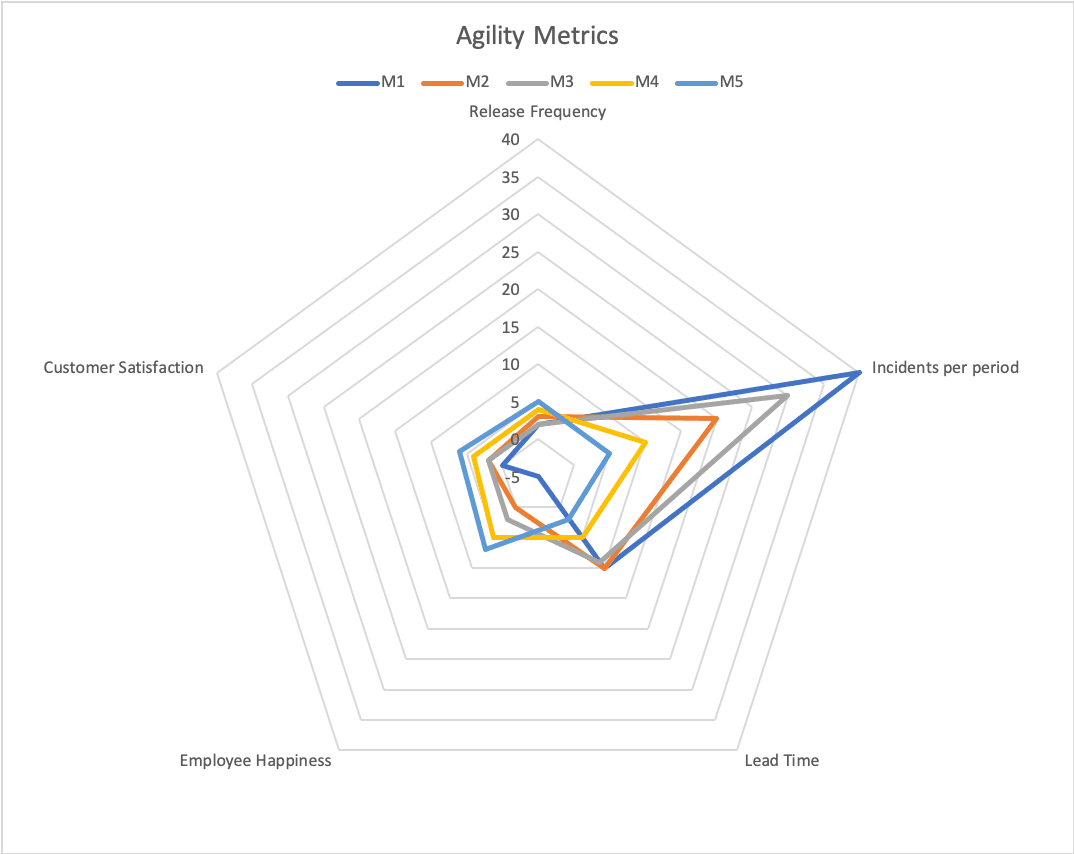
Leaders are often interested in understanding the impact of adopting agile working methods. This post explores five key metrics that help business leaders track improvement across teams and products within the organisation. These metrics are significant indicators that can pave the way for innovation, resilience, and sustained growth.
Release Frequency: A measure of how often an organisation releases updates to its product(s) is one of the primary indicators of whether it has developed its business agility capabilities. Agile frameworks such as Scrum help organisations release value frequently to users. Before a product is built, the value it brings to its target users is assumed, and organisations validate the assumptions when the product is eventually released to the customer. An organisation with an increased release frequency potentially collects user feedback more frequently.
The organisation should aim to increase the release frequency for its products over time; a higher release frequency enhances business agility by enabling faster innovation, responsiveness to customer needs, and adaptability to market changes. There are several factors that we might consider to increase the release frequency of its products:
Investment into continuous integration/deployment capabilities
Automated Functional and non-functional testing.
Improved Product Management capabilities, including capturing and analyzing user feedback.
Creating cross-functional teams as part of organization design efforts.
Incidents per period: Product teams are accountable for delivering usable products to their customers, and incidents, when they occur, take away from the usability of your products. Incidents refer to product downtime, product crashes, and undetected defects in the product, among many others. Leaders should encourage and support the product team to reduce the number of incidents that users experience per period. Organisations should invest in technical capabilities that help automatically capture these sorts of issues from logs and, in addition, a medium for users to report such matters.
Organisations buy a lot of customer goodwill if these issues can be detected and rectified before they are visible to users. To ensure that a product remains valuable to its users, the incidents per period should trend lower over time. Some factors that could help decrease their Incidents per period include:
Capturing technical debt as first-class product backlog items.
Increased automated tests around features that are prone to incidents.
The product team is committed to reducing technical debt over some time.
Improved analytical capabilities in user logs to spot potential issues.
Lead Time: Product development is complex. Complex implies no direct relationship between cause and action [Ref: Cynefin framework]. In simpler terms, there are no guarantees that the assumptions the product team will make in building the product will be the reality. As a result, the sooner an organisation can implement its ideas and put the product in the hands of a user, the earlier the assumed value of the product can be validated. Building a product is expensive, and until a product is released to its users, the budget expended up till that point could be likened to “unsold inventory”, as in the case of traditional business.
Lead time is the elapsed time from the idea to the working product in the customer's hands. Often, the product team finds it easier to measure cycle time, which is the time from when a task is in progress to the product in the customer's hands. Cycle time can be measured in place of Lead Time, but ultimately, the product team should improve their backlog management system to capture Lead Time.
It is worth pointing out that increasing the release frequency should reduce the lead time; however, measuring and visualising the lead time provides additional value in its own right.
Factors that improve Lead Time include:
Reducing and eventually eliminating any wait times in the system
Helping to limit work in progress.
Automating testing and deployments.
Employee Happiness Index: In our work with clients, we have observed that Leaders do not pay enough attention to a fundamental metric: the happiness levels of the people who get work done. Over time, leaders seem to assume that employees who do not show signs of unhappiness must be happy, but our work has shown that this is not the case.
Employees who are unhappy at work and have decreasing levels of morale cannot deliver valuable products that users love. In a recent organisational transformation engagement where we noticed employee morale was tanking, the leaders asked the team to increase release frequency and lower cycle time. Still, the teams could not improve these metrics without a buy-in from the leaders to make certain decisions that involved investing in automation and restructuring the teams. The leaders also assumed that it was easy for the teams to improve. We could only get leaders to engage after running the teams through an employee happiness survey, which came back with negative scores. We were able to co-create several initiatives with the product teams.
Ways of working that provided autonomy and purpose for the teams.
Leaders' commitment to funding the infrastructural changes to reduce cycle time and increase release frequency.
Increasing psychological safety within the team.
Engaged and Happy employees are more likely to embrace change, contribute innovative ideas, and collaborate effectively, fuelling your organisation's agility and success.
Customer Satisfaction: Building products that continually deliver user value requires a lot of work, and organisations that create valuable products can expect customer satisfaction to improve over time.
The four other metrics—release Frequency, Incidents per period, Lead Time, and Employee Happiness—all contribute to improving customer satisfaction. Several techniques have been used to measure customer satisfaction, including Net Promoter Score (NPS) and Customer Churn rate. Alternatively, the product team could consider deploying telemetry, which provides information on users' behaviours within the product.
Customer Satisfaction metrics provide valuable insights into how the product meets and exceeds customer expectations. By actively listening to your customers and adapting your products, services, and experiences accordingly, the product team fosters loyalty, builds long-lasting relationships, and stays ahead in a competitive market.
At ValueHut, our agile consultants and coaches have over 20 years of experience helping organisations develop organisational agility capabilities. We measure our outcomes based on improving these five foundational metrics. Every engagement begins with a conversation. Contact us today for a no-fee discussion.
Share to